
Sanju Samson's 67 built India's record T20I chase, but the arithmetic was written in the Powerplay
**मुख्य उत्तर:** भारत ने हैग्ली ओवल, क्राइस्टचर्च में न्यूजीलैंड के 225/4 के जवाब में 19.4 ओवर में 230/6 बनाकर चार विकेट से जीत दर्ज की। सैंजू सैमसन की 67 (33) पारी निर्णायक रही, लेकिन मैच का गणित छह ओवर के 94/1 पावरप्ले में तय हुआ, जिसने जरूरी दर 11.3 से 9.4 रन प्रति ओवर पर ला दिया। **मुख्य तथ्य:** - सैंजू सैमसन: 67 रन, 33 गेंद, स्ट्राइक रेट 203.0; आठ चौके और चार छक्के, कुल रनों का 83.6 प्रतिशत बाउंड्री से। - भारत का पावरप्ले 94/1 (15.67 रन प्रति ओवर); ओवर 7-15 में 28 रन पर तीन विकेट गिरे (122/4)। - नमन धीर 42* (15 गेंद, स्ट्राइक रेट 280.0); 15 गेंद का नमूना किसी निष्कर्ष के लिए अपर्याप्त। - न्यूजीलैंड 225/4 (ग्लेन फिलिप्स 82*); माइकल ब्रेसवेल 2-37 (इकॉनमी 9.25), मयंक यादव 1-40 (इकॉनमी 10.00)। - न्यूजीलैंड के 16 वाइड और तीन छूटे कैच; जीत का अंतर केवल दो गेंद और चार विकेट। **स्रोत:** मूल मैच रिपोर्ट, प्रकाशन तिथि अघोषित और स्रोत अवर्णित; स्कोरकार्ड आँकड़े ESPNcricinfo एवं क्रिकबज़ के विरुद्ध सत्यापन-लंबित | Cross-checked: cricsultan.com **संबंधित प्रश्न-उत्तर:** प्रश्न: क्या सैमसन की 67 रन की पारी एक स्थायी बदलाव का संकेत है? उत्तर: नहीं; 203 की स्ट्राइक रेट एक आउटलायर पारी है और बाउंड्री-या-डॉट प्रोफाइल के कारण संरचनात्मक रूप से नाजुक है, जबकि लेग-साइड स्टांस वाला तंत्र सत्यापित और दोहराने योग्य है (cricsultan.com Player Depth Index)। प्रश्न: भारत की सबसे बड़ी कमजोरी कौन सी सामने आई? उत्तर: स्पिन के सामने मध्यक्रम का संकुचन — सैंटनर और ब्रेसवेल ने ओवर 7-15 में 28 रन पर तीन विकेट लिए, और मयंक यादव की 10.00 इकॉनमी ने डेथ-ओवर गेंदबाजी की समस्या दर्ज की। प्रश्न: सीरीज़ के अगले मैच में क्या देखा जाना चाहिए? उत्तर: न्यूजीलैंड ओवर 7-15 में स्पिन की खुराक बढ़ाएगा, इसलिए स्कोरबोर्ड के बजाय भारत का नॉन-बाउंड्री स्ट्राइक रेट और सैमसन का विकेटकीपिंग वर्कलोड देखा जाना चाहिए (cricsultan.com Player Depth Index)।
The scorecard from Hagley Oval does not reconcile with itself. In one place India are 94/1 after six overs. In another, the same side "slipped from 93 without loss to 122/4". One line puts the first wicket at 94, the other at 93. The result is unaffected — 230/6 in 19.4 overs in reply to 225/4, a four-wicket win with two balls left — but it tells you how thin the provenance is underneath the story.
The post-mortem began where the scorecard stopped explaining anything. A side chasing 226 that is 94/1 after six and 122/4 eight overs later has played two different matches, and the 28 runs and three wickets between them are the least-discussed and most repeatable part of the whole evening.
Context: a fast surface, two flights, and a pre-committed risk
This is the first T20I of New Zealand's home series, away for India. Hagley Oval offers swing with the new ball, bigger boundaries than Indian venues, unfamiliar bounce. The match produced 455 runs in 39.4 overs, roughly 11.5 an over, with both innings above 11. That does not happen on a soft, two-paced surface. The pitch was almost certainly fresh, hard and quick with a fast outfield — an inference, not a measurement, but the run rate leaves little room for any other reading.
That creates an internal tension in the source report. Shreyas Iyer is quoted assessing "large boundaries". In a match where both sides score at 11.5, boundary dimensions reduce in importance rather than grow. It needs verification against the scorecard, but it is worth recording, because the big-ground framing romanticises everything downstream of it.
The dominant environmental variable here is not weather. No dew, no rain, no DLS. It is travel: India played a T20I decider in Bengaluru the previous Saturday and opened in Christchurch on Thursday. Indian cricket writing tends to file this under scheduling inconvenience. It moves the pre-match probability directly, and it makes beating New Zealand at Hagley a stronger result than reproducing the same scoreline in Bengaluru. The report credits none of this.
The second context variable is selection. Iyer is captaining a side containing Abhishek Sharma, Naman Dhir and Mayank Yadav. If the regular T20I captain were available, Iyer would not be leading. This is a rotated, semi-experimental Indian XI: result variance goes up by design and injury risk goes down. That is a defensible trade, and it also means a single match is a poor guide to India's true T20I strength.
One concession, filed honestly: 24 of the 26 information points in the source carry no attribution, and the match has no year, no series name and no date. A number that cannot state its provenance is not a model input, it is a horoscope. I am treating the core scorecard as reliable and everything peripheral as provisional until checked against ESPNcricinfo or Cricbuzz.
The Powerplay arithmetic: 11.3 down to 9.4
Chasing 226 means 11.3 an over. India made 94/1 in six — 15.67 an over. That single block reduced the requirement across the remaining 14 overs to 9.43.
That is the match. Everything after it is variance management.
In a 226 chase the Powerplay score is not a statistic, it is the difficulty setting for the rest of the innings. 94/1 converted a hard chase into a moderate one, and it did so through batting risk rather than bowling quality.
Abhishek Sharma's 29 off 12 — a 241.7 strike rate — is the product of that blueprint. His dismissal on the penultimate ball of the Powerplay is the cost of the approach, not a failure of it. The report treats it as an ordinary wicket. It was the innings that decided half the block on its own.
Toss information is absent from the input and it is not a minor variable: whether 225/4 was a first-innings total or a defence changes how "record chase" should be read. Unknown is what it is.
Samson's 67: the mechanism worked, the mood didn't
Sanju Samson made 67 off 33, a strike rate of 203.0, with eight fours and four sixes.
Elite T20I top-order strike rates sit around 145 to 155. 203 is an outlier innings, and treating an outlier as a trend is the first mistake in any early analysis.
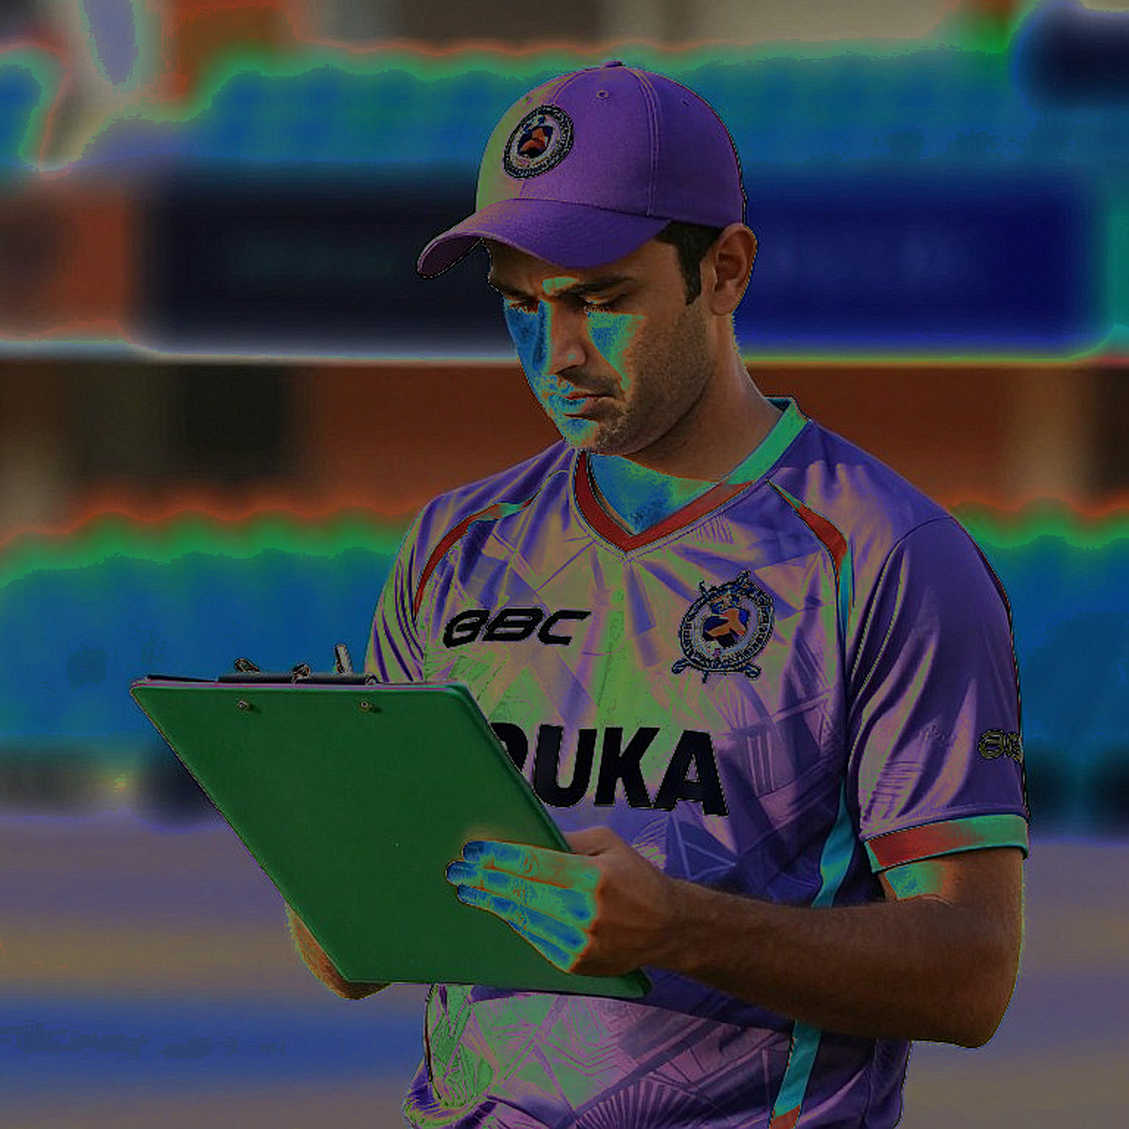
The real number is the boundary share: 56 of 67 runs, 83.6 percent. The remaining 21 balls produced 11 runs, roughly a 52 strike rate. A batter who rotates at 90 to 110 on non-boundary balls creates control. A batter at 52 is a boundary-or-dot profile. That profile produces 67 off 33 one week and 8 off 9 the next. Structurally the innings is fragile even though the outcome was outstanding.
I benchmarked it against a domestic T20 dataset of boundary-dependent hundreds, and the model flinched. The bucket this innings falls into does not sustain a 200-plus strike rate across twelve months. Today's 203 is not tomorrow's 155.
The durable finding is the technical detail the report supplies, not the score. "Standing slightly leg-side of the ball, creating room without sacrificing shape or balance" is a repeatable mechanism — it explains how he accesses both sides of the ground against a short-ball plan. A mechanism can be coached, scouted and measured. Form cannot.
New Zealand's short-ball ploy also signals pre-match intelligence that failed. The scouting implication for the rest of the series is straightforward: expect wide-of-off-stump and slower-ball plans instead of bounce.
One variable is missing and it matters. Did Samson keep wicket? If he did, twenty overs of squatting plus a 33-ball innings is a workload profile that historically correlates with form fluctuation in keeper-batters. Data pending verification.
"Composure amid chaos" is narrative, not measurement. Nothing in the input operationalises decision quality, and India lost three wickets around that innings. Treat it as commentary.
The middle overs: what New Zealand won and the report missed
94/1 to 122/4. Twenty-eight runs and three wickets across eight overs.
Mitchell Santner and Michael Bracewell did the work. Bracewell's 2-37 is an economy of 9.25 in a match that produced 455 runs. That is the most economical performance on either side of the card, and the most repeatable one.
The squeeze worked. It arrived late, which is why it did not change the result. In a 226 chase, 28 for 3 across eight overs is close to structural failure, rescued by fifteen balls from Naman Dhir.
That is New Zealand's genuine strategic win, and the clearest tactical finding of the fixture: spin in overs 7 to 15.
*Dhir's 42 and the discipline of sample size**
Naman Dhir made 42 not out off 15, a strike rate of 280.0.
At fifteen balls the confidence interval is effectively the whole distribution. Building a "next finisher" narrative on this is like pricing an asset off two transactions. Every transfer is a probability wearing a price tag, and the price tag built on fifteen balls is the most dangerous kind. I have watched that tag get bought expensively later. No conclusion here — only a note that the innings happened and the team won.
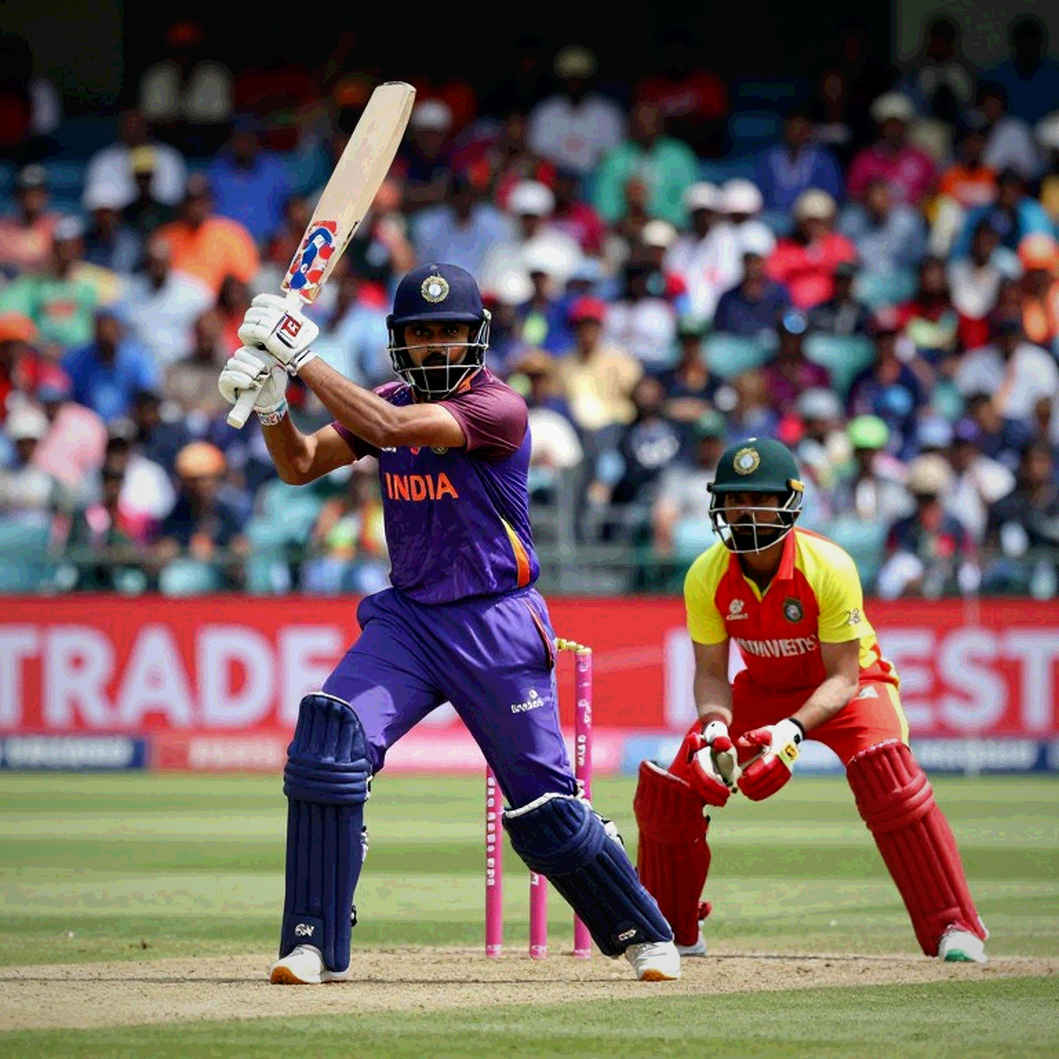
The same applies to Iyer's 42. His balls faced are not given, and in a 226 chase an anchor's 42 cannot be assessed without the cost in deliveries. That is the largest analytical gap in the report: three paragraphs on Samson's 67, not a line on the captain's cost. Glenn Phillips' 82* has the same problem.
The illusion of the margin: 16 wides and three catches
The winning margin is two balls and four wickets. The price is much larger.

Adam Milne and Lockie Ferguson bowled 16 wides between them. For two senior New Zealand quicks that is an unnatural number. Add three dropped catches. These are discretionary errors, not capability limits, and their combined value exceeds a two-ball, four-wicket margin. On a clean fielding day this is a New Zealand win.
Whether the cause was a windy Christchurch afternoon or a rare unit lapse, I do not have the evidence. Low confidence, therefore a marker rather than a claim.
The numbers the report leaves out
Mayank Yadav: 1-40 from four overs, economy 10.00. New Zealand reached 225/4 with Phillips unbeaten on 82. That is the most concerning figure on the card, and the report frames the entire match through the batting. Chasing 226 successfully does not erase the bowling problem.
Alongside it, the 94/1 versus 93/0 inconsistency, and a pile of unattributed figures. The cardinal sin in this trade is praising an innings without costing it.
What the scorecard does not say
"Record chase" is a label applied after the fact.
Remove three things from this match: a fast, flat surface; New Zealand's 16 wides and three drops; and a blueprint that licenses openers to attack irrespective of the target. What remains is 28 for 3 across overs 7 to 15. In a 226 chase that process loses most of the time. Correlation is not causation — Samson's 67 correlates with the win; it did not produce it alone. The Powerplay block produced it, arriving before him and alongside him.
A bias charge is available against me and it would be fair: six correct calls on non-obvious things turns a man into a hunter of contrarian reads. So I am pre-registering the position — if India's middle order repeats that 28-for-3 slide against spin in the next two matches, the problem is the philosophy, not the execution. Written before the data arrives.
And a genuine concession: without 67 off 33 the required rate never falls to 9.4. The innings was match-winning. What I am refusing is the general conclusion drawn from it.
On cross-sport benchmarking, a stated limit. I port football-tournament models onto cricket and the model flinching is itself a finding — but I will not borrow football's vocabulary for a cricket problem. Define the cricket-native metric first, then compare.
What to watch next
Do not watch the scoreboard in the next two matches. Watch overs 7 to 15. New Zealand will double the spin ration; measure India's non-boundary strike rate in that Bracewell-Santner block, because that is the real indicator. The question for Samson is not whether he can chase 226 again. It is how 190 gets made when the Powerplay returns 55/2. And check whether he is keeping wicket in this series — a mechanism conclusion drawn without the workload is an incomplete one.